Unclassed Choropleth maps are used by shading in the picture to show off the data. So there may not be any numerical data shown but everything is communicated through shading and through the color of the map.
Map found here: http://www.agocg.ac.uk/
Unclassed Choropleth maps are used by shading in the picture to show off the data. So there may not be any numerical data shown but everything is communicated through shading and through the color of the map. A Classed Choropleth map is one that is a thematic map that shows things through colors on maps. Here we have a 1992 beef cattle emissions in North Carolina. It is broken up by county and color. There is a key on the bottom left and it shows the different amounts of methane emissions from beef cattle.
 This map to the left is a range graded circle proportional map. The circles here are showing the Mexican population in Western United States in 1990. The biggest the circle the larger the range of number of Mexicans.
 This is a map of France in Europe. The circles are proportionate to the variable that is being measured. This map shows the different types of meat that were sent to butcheries that were in France. The larger the circles the larger the proportion to the data being measured.
 Digital Elevation Model. What this is is a 3D model showing the elevation of a certain figure. This picture to the left is just showing the elevation of a mountain. This is known as a type of relief map. As it shows the relief of different structures in 3D
 A DLG is a digital line graph. This shows different information through the USGS topographic maps. These maps are typically in vector form. This map here to the left shows the different water ways of Athens Georgia in the time that the olympics were held there.
 An isoplethic map is another map that uses lines to show it's data. The difference between this and the others is that this shows it's data in 3D. This map shows the concentration of CO2 in the soil in the summer of 1997.
 An Isopach is a map that measures the thickness of something. The lines in the map are what show how thick it is or how thick it isn't. Usually having to do with rocks. This map to the left has to do with volcanic ash.
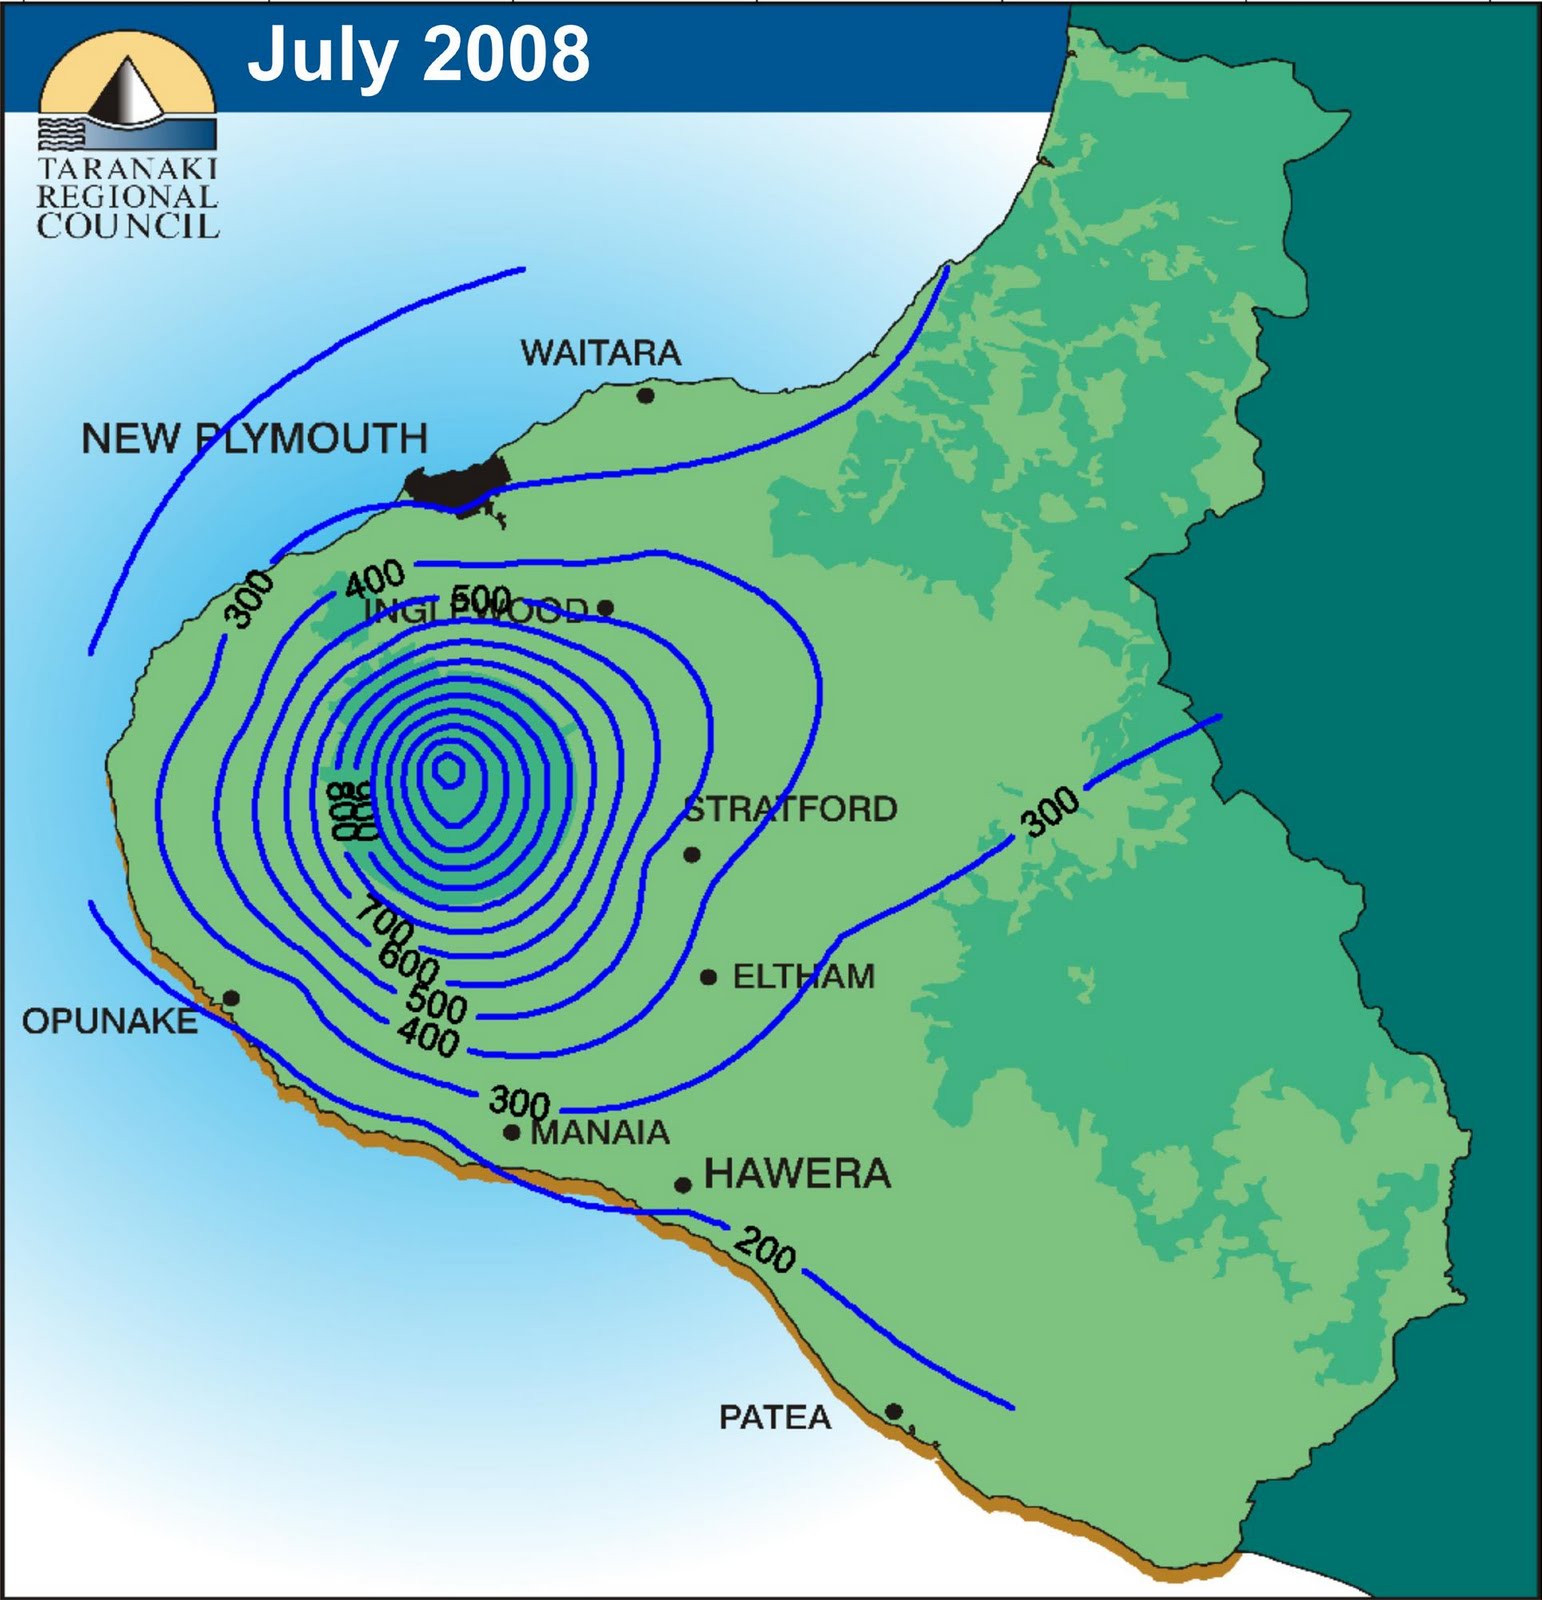

 An isobar is something that is used to show barometric pressure in the atmosphere. It shows it by a bunch of small lines or bars. The small lines that you see going throughout the image are the isobars. They show the change in pressure throughout the atmosphere.
 A LIDAR map gets its name from light, detection, and ranging. It measures the properties of the scattered light to find the range of things in the distance. Here in the picture to the left is a LIDAR image of a downtown city. This picture was taken again, by measuring the properties of scattered light. This shows the site in NYC of the World Trade Center in 2007.
 A doppler radar is most commonly used in weather. It uses the Doppler effect and captures things at a distance. This is also used in radar guns. The pictures that we use with it though, again, are typically weather projections. The map that I have here is a Doppler projection of a tornado.
 A black and white aerial photo is pretty simple. It is an aerial photo that is shown in black and white. Here I have an image of Wrigley Field in Chicago. It is the baseball field home of the Chicago Cubs.
 This is an infrared photo of the Parker river in Newbury, Massachusetts. Infrared imaging shows things that are sensitive to the infrared light. It has to do with the photo-spectrum. Here you can see all the land near the river.
 A cartographic animation is just like a cartographic map however there is an animation with it. When the animation is playing the figure on the map is moving. In my opinion the best example of this is weather. In the map to the left when set in motion it will show the movement of hurricane Katrina.
 A statistical map is just what it sounds like. It is a thematic map that shows a certain statistic of a certain area. This map to the left just happens to show a statistic of the world. A statistical map could be for an area as small as a county or city and as big as a country or the whole world. The statistic shown here is what countries use to get online. Most countries are in purple which shows they use the internet.
 Cartograms are another thematic type of map that show something other than typical land area and distance. The geometry of the maps is always altered to show what the map is trying to show. The changing of the geometry gives more effect where information is wanting to be conveyed. This map shows results of a presidential election in 2008. The blue being republic winnings and red being democratic winners. These maps are not always completely accurate because this doesn't show how every single person voted just the total numbers of counties.
 A flow map is a map that shows movement from one area to another. This map to the left is a little unconventional. In this course we usually talked about maps that show places however this is a flow map that shows an action of giving candy to a friend. It is a little different but shows the same idea. Moving from one are to the next.
 A proportional circle map displays the data it is trying to convey by using different sizes of circles. In this map it shows the urban population mostly in Michigan. However it does show a small piece of a few other states. The key is in the top right of the map.
 A choropleth map is one that has a certain theme to it and is shown by different colors. In this map to the left the theme can be seen in the title. It is the U.S. divorce rates by county. There is a key in the bottom left corner of the map. This map conveys so much data because it breaks down every county in the United States. It can be hard to read and see each county but it is easier to convey data when using colors in my opinion. Choropleth maps are my favorite.
 A dot distribution map is a map that uses dots to show data that it is trying to convey. In this map to the left, it is from the 2000 census from Fauquier Country, Virginia. Each dot in these types of maps relates to some data and in this map each dot represents 10 people. So if you count up all the dots and multiply by 10, you will have the population of Fauquier County!
 A propaganda map is a map that's intentions are for some gain other than direction. For example, propaganda maps are usually made to put forth some other message. Most intend to spread news, to scare, or to convey a message. In this propaganda map is shows Europe. And different dogs wearing the flags of the country they are from. They are all barking and fighting at each other. Probably showing a time when Europe was all at war with one another. With one man whipping and controlling them.
 A hypsometric map is typically a map that shows elevation in a specific area. Here in the Goiania Metropolitan Area, its elevation is showed. It is shown through 3-dimensional relief features. Some hypsometric maps show the changes in elevation through shading or color. This one does that as well. You can see what the colors match up to by the key on the right.
 A Cadrastal Map is one that shows the division of ownership of land in a certain area. in the map to the left you can see the distribution of different pieces of property in a certain area. You can see that different types of property are also divided by color. These kinds of maps can also show more information such as addresses or county names. This map, however, does not.
 A thematic map is a map that shows a particular theme in a geographic area. In the map to the left this shows the percent of population change in the United States between the years of 1990 and 19996. The map shows the different amounts by using color and the key of the map is to the right of the map.
 This is a topographic map of India. A topographic map is much different than a planimetric map. The purpose of these maps are to show large scale detail of relief features. In this map it shows the altitude of the different relief of India. You see the key in the bottom left of the map. Some Topographic maps use contour lines to show differences in data.
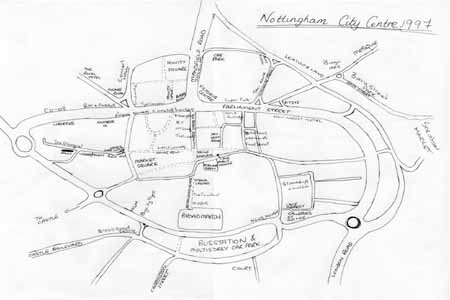
 A planimetric map is a map that is strictly 2-dimensional. In this map of Yukon there is no relief features shown. Maps like these are used to show data. They are flat and have nothing to do with the land just statistical data.