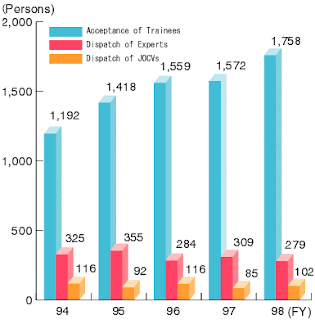
 A bilateral graph shows two different things. It shows data when something is negative and when something is positive. This graph to the left has to do with japanese environmental issues. You can see how there are more than 1 types if variables on the graph.
Map found here: http://www.mofa.go.jp/policy/oda/category/environment/pamph/2001/oda.html
No comments:
Post a Comment